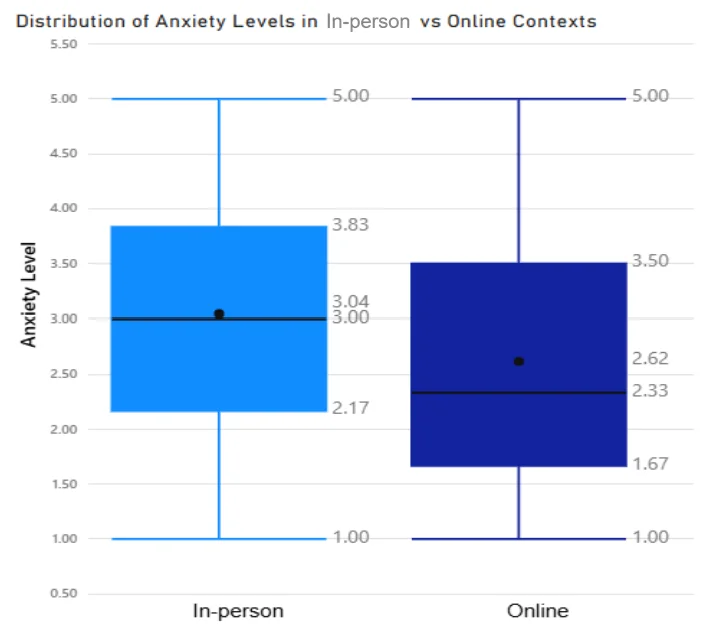
Investigating belonging across digital and physical student life
CCA updates, school achievements, and social plans circulate through digital channels. For students, staying connected can also mean being continually aware of experiences they are missing. Our Statistical Research Methods (SRM) project investigated that tension through fear of missing out (FoMO): the desire to remain connected with what other people are doing.
We developed a survey study with two complementary questions. First, was general FoMO higher among the surveyed first-year students than a published adult-study reference? Second, did those same students experience different levels of anxiety when missing in-person gatherings and online interactions?
Together, the questions connect the extent of FoMO with the settings in which students experience exclusion. The final report brings the research context, questionnaire, primary and secondary data, hypothesis-testing plan, statistical working, visual analysis, and recommendations into one study.
My contribution covered the quantitative analysis and synthesis: Excel calculations before the manual working, assistance with manual calculations, interpretation of the calculation results, and the findings summary. Teammates led the topic, survey creation, research statements, hypothesis design, and visualizations. The research design and charts presented here are team outputs.
Designing measures that answer the research questions
General FoMO: connecting the survey to existing research
The team collected 67 valid responses from Year 1 polytechnic students through Google Forms. All 16 questionnaire items used a five-point agreement scale, from strongly disagree to strongly agree.
Ten items adapted from Przybylski and colleagues’ 2013 FoMO questionnaire assessed general FoMO. They covered concerns about others having more rewarding experiences, friends having fun without the respondent, missing planned gatherings, and keeping up with what friends are doing. This gave the study a defined construct and a link to the literature used for the external comparison.
The reference mean of 2.56 came from a published sample of 1,013 adults aged 18–62. Using an established questionnaire as the starting point makes the comparison more interpretable, while the different populations still need to be considered when drawing conclusions.
In-person and online anxiety: matching the experiences being compared
The remaining six items formed two sets of three. The questions addressed corresponding experiences in each setting:
| Aspect of exclusion | In-person setting | Online setting |
|---|---|---|
| Missing the interaction | Missing an outing with friends | Missing a voice call or gaming session |
| Seeing what was missed | Seeing photos or videos of the gathering | Seeing screenshots or recordings of the session |
| Concern about the friendship | Feeling a missed meetup affects the friendship | Feeling a missed online hangout affects the friendship |
That structure gives the comparison more substance than asking whether students prefer physical or digital events. It examines worry, perceived exclusion, and concern about friendships across comparable situations. Each student answered both sets, allowing the analysis to preserve the link between their experiences.
Building the numerical foundation in Excel
The analysis first averaged each respondent’s relevant items into a general FoMO score, an in-person score, and an online score. It then calculated an individual difference as in-person minus online. Averaging keeps all three measures on the original 1–5 scale.
67 respondents × 16 questionnaire items
  → 10-item general FoMO average per respondent
  → 3-item in-person and 3-item online averages per respondent
  → 67 within-person difference scores
  → sample summaries and two hypothesis tests
I performed the Excel calculations before the team’s manual calculations and helped with the manual working. This contribution connected the survey’s scoring rules to the numerical evidence used in the report: sample means, variability, standard errors, and the test calculations supporting the conclusions.
The calculation work requires keeping two different units of analysis clear. The first test uses each person’s general FoMO score. The second uses each person’s difference between settings; the variability of those differences matters, rather than simply comparing two overall averages.
Establishing the descriptive picture
| Measure | Sample mean | What it describes |
|---|---|---|
| General FoMO | 3.11 | Overall concern about missing others’ experiences |
| In-person exclusion anxiety | 3.04 | Responses to missing physical gatherings |
| Online exclusion anxiety | 2.62 | Responses to missing online interactions |
General FoMO had a standard deviation of approximately 0.83. Both context scores spanned 1 to 5, so the averages sit within a wide range of individual experiences. These summaries establish the direction and scale of the patterns before the statistical tests assess them.
Testing whether general FoMO exceeds the reference
The student sample’s underlying mean was 3.109, compared with the reference of 2.56: an observed difference of approximately 0.55 points.
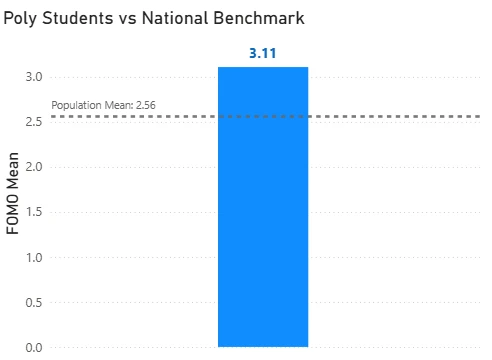
The student mean is approximately 0.55 points above the adult-study reference. The team assessed that gap with a one-sample t-test; the original National Benchmark title refers to this external study, rather than a universal national norm.
View full-size figureThe chart makes that gap visible. Its original title uses “National Benchmark”; the comparison is with the external adult study described above.
The team’s right-tailed one-sample t-test matched the research question of whether the mean was higher than the reference. A 5% significance level was set in the hypothesis-testing plan.
The calculation connects the observed difference to its uncertainty. With 67 responses and a sample standard deviation of approximately 0.827, the reported standard error was approximately 0.101. Dividing the mean difference by that standard error gave t ≈ 5.43, with 66 degrees of freedom. The reported result supported a higher mean than the reference at the chosen significance level.
This is where my interpretation work mattered: the conclusion rests on the relationship between the difference, variability, and sample size, beyond the taller bar in the chart. It supports a comparison for this sample; it does not establish that campus life caused higher FoMO.
Testing how exclusion differs within the same student
The second question required a paired t-test because the two scores belonged to the same respondent. Keeping them paired accounts for differences in students’ baseline anxiety when comparing the settings. A two-tailed test assessed a difference in either direction, rather than assuming in advance which setting would produce higher anxiety.
The mean within-person difference reported in the study was approximately 0.43 points, with higher anxiety for missing in-person experiences. The team’s paired test reported a difference at the 5% significance level.
Reading the main figure alongside the test
The box plots shown on this project’s cover are repeated here. They show where the typical responses sit and how much the experiences vary:
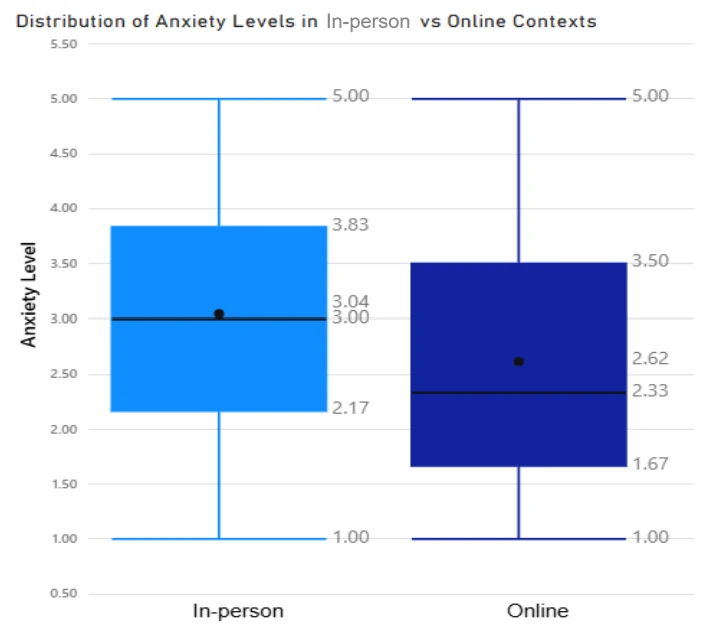
The cover figure compares the centers, spread, and overlap of anxiety scores. Higher in-person means and medians complement the paired analysis, which uses each student’s difference between settings. Chart from the team report.
View full-size figure- Central values: the in-person mean is 3.04 and median is 3.00; the online mean is 2.62 and median is 2.33. Both summaries point toward greater in-person anxiety.
- The middle half of responses: the in-person scores span approximately 2.17–3.83, while online scores span 1.67–3.50. The in-person box is positioned higher on the scale.
- Variation and overlap: both settings cover the full 1–5 range, and the boxes overlap substantially. Students’ experiences differ even though the sample shows an overall tendency.
The figure summarizes each setting’s distribution; the paired test uses the respondent-level differences. Reading them together brings the statistical result back to the survey: the study found a pattern across students without implying that every respondent felt more anxious about missing an in-person gathering.
Synthesizing findings into campus wellbeing recommendations
The two analyses answer different parts of the social issue. The benchmark comparison suggests elevated general FoMO in the surveyed group relative to the published reference. The paired comparison suggests that missing face-to-face gatherings carried greater anxiety, on average, than missing online interactions.
In the findings summary, I helped connect those results to the study’s broader concern about digital habits and belonging. The report proposed two directions for institutions and campus organizations:
- Support healthy digital boundaries. Help students disconnect without feeling that they will incur a social penalty or lose track of their community.
- Prioritize meaningful in-person connection. Give high-quality physical gatherings attention in campus programming, alongside the convenience of digital communication.
These are recommendations arising from the study, rather than measured effects of an implemented programme. Their value is that they connect the evidence to concrete questions for student-support and event-planning teams: how to reduce pressure to remain constantly connected, and how to create opportunities for belonging.
The completed project shows my ability to work through quantitative calculations and communicate their implications within a research team. It required moving between questionnaire measures, spreadsheet summaries, manual statistical reasoning, visual evidence, and a written findings synthesis that a reader could use.
Scope and further research
The findings describe these 67 respondents. The external adult reference represents a different population, and the survey does not establish causes of FoMO or prove which campus intervention would work. Further research could document sampling and questionnaire reliability more fully, report confidence intervals and effect sizes, and test the proposed support approaches.
The survey design, charts, and reported results come from the team’s submitted SRM report. The external reference is Przybylski, Murayama, DeHaan, and Gladwell (2013), Motivational, emotional, and behavioral correlates of fear of missing out, Computers in Human Behavior, 29(4), 1841–1848.